The numbers Mini Melts leadership asked for, on one live dashboard
Leadership wanted specific social stats to steer content and strategy, cut in ways no off-the-shelf tool offered. We built the dashboard they described, and they ran on it for nine months.
The problem
Each platform reports differently, and none of them showed the views leadership wanted. The team stitched numbers together by hand, and the questions leadership cared about had no clean answer.
What we built
- 01
Direct connections to each platform
API links to Facebook, Instagram and TikTok, plus a small custom Facebook app to pull the data standard reports leave out.
- 02
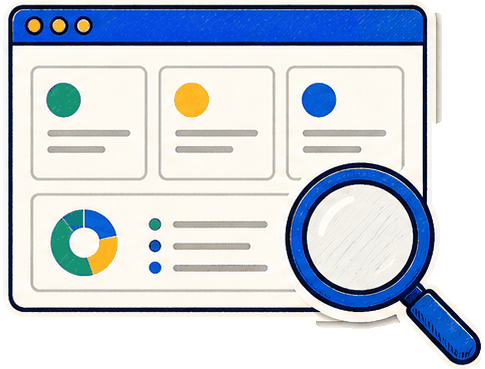
One custom dashboard
Every platform's numbers in one place, refreshed automatically, built around leadership's own KPIs.
- 03
Filters for every question
Leadership could slice by platform, post, period and metric to build the view they needed, without asking anyone to run a report.
Built with
- Facebook, Instagram and TikTok APIs
- Custom Facebook app
- Custom dashboard with filters
How we prove it works
Before we build, we agree on a test set of real examples and a 90% pass mark. Every month we report what passed and what we fixed.
Where does the work get stuck for you?
Thirty minutes. We'll tell you whether there is a worthwhile first win.